Evolve Shop Update 2024.03.0
Deployment:
The deployment window where any customer may have been impacted was on 10/10/2024 at 5:00pm EST. Finished validation of the release on 10/10/2024 at 6:00pm EST.https://help-foresite.evolvemep.com/article/16136tfsam
Resources
- Feedback and Ideas: https://evolveforesite.featureupvote.com/
- Support: https://www.evolvemep.com/contact-support/
- Foresite: https://foresite.evolvemep.com/
- EVOLVE University: https://evolvemep.skyprepapp.com/
Summary
The following features, enhancements, and fixes were made with this release:
🎉New
Insights
We are excited to announce the release of our new feature called Insights. This new analytics and reporting feature set gives you the ability to gain insights into the data you currently have stored in Evolve Shop today. Insights lets you visualize your data and trends over time so that you can see road blocks and improve your internal processes all in an effort to gain efficiency.
- Lead Times- There are many stages between the start and completion of a project and knowing your lead times enables you to stay on schedule and deliver timely projects. Lead times serve as a key business metric.
- insights stat boxes provide up-to-date information for Avg. Manufacturing, Production and Order lead times. Order lead times will help your project teams better plan for fabrication while manufacturing and production lead times can help your shop managers identify inefficiencies on the shop floor
- faster lead times mean quicker delivery to the jobsite and a faster time-to-value
- Keep work on schedule- assess whether or not work is proceeding as planned and make adjustments when required
- Shop Performance- monitor and evaluate fabrication performance over time and view statistical trends
- uncover opportunities to drive continuous improvement
- Track production- helps project stakeholders stay informed and updated in real time
- project mangers, superintendents and field foreman can understand what's happening with fabrication work requests and can take a proactive approach to solve issues
- Generate detailed reports- the report data grid allows you to filter data as required to produce reports like:
- Work request and Work order management reports
- WIP & late reports
- Project planning and look-ahead reports
Access
- Users set as Company or Shop Administrators will have access to insights and be able to view data for both work requests and work orders
- Users set as Project Administrators will have access to insights and be able to view data for work requests only
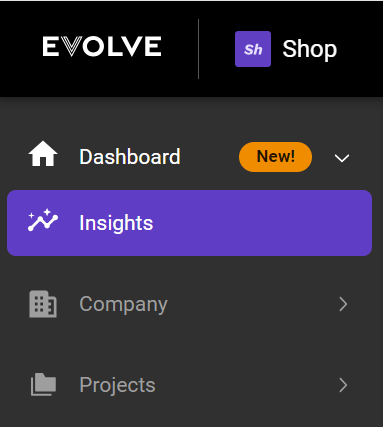
To open insights, select Dashboard from the left nav bar and then Insights
Default data set
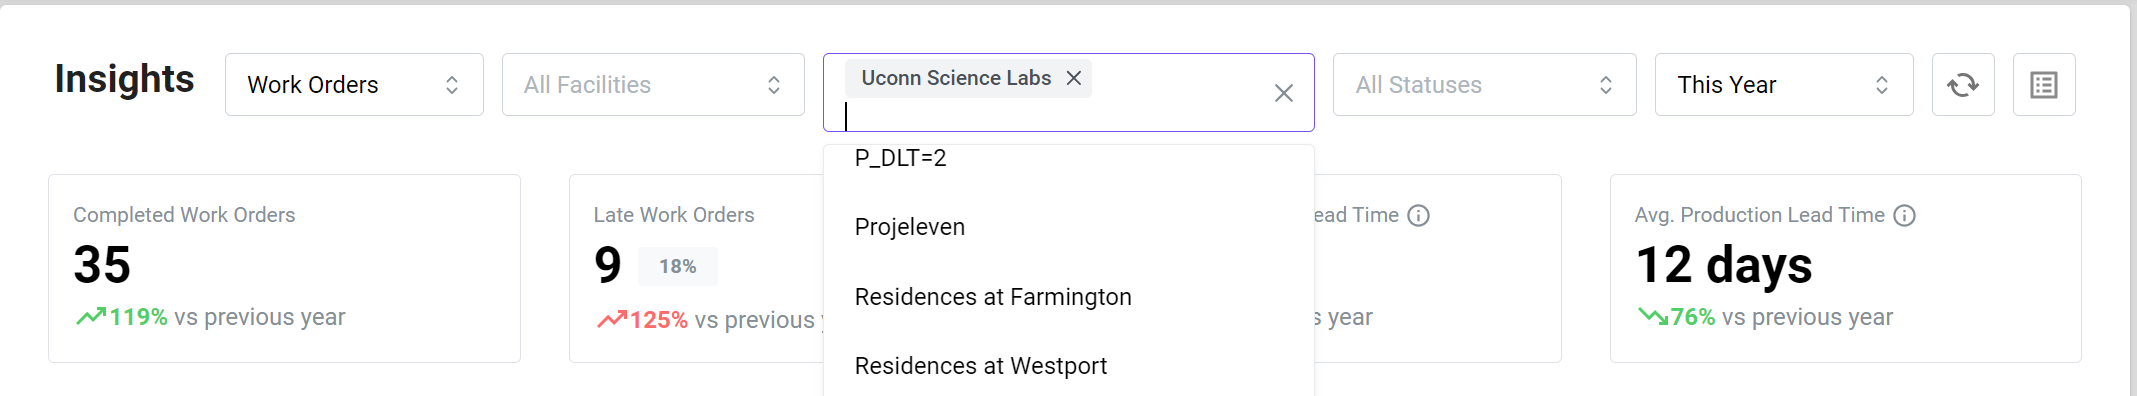
When the insights page is first displayed the dropdown selectors will default to 'Work Orders' for company and shop administrators and 'Work Requests' for project administrator's, additionally the facilities, projects and statuses dropdowns will be defaulted to 'All' with the date range dropdown set to 'This Year'
Changing the data set
- You can modify the data set by making selections in the dropdowns located at the top of the page. You are able to make one or more selections as desired
Updating the data set
- To update the data set in the chart click the refresh button
 changing from Work Request to Work Orders is the only time the data set will be automatically refreshed
 - Hovering over the refresh button will display the last time the data set was refreshed
Stat boxes
Stat boxes provide relevant data related to work requests and work orders as wall as statistical comparisons
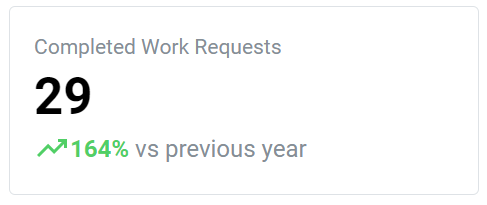
Completed Work Requests and Work Orders
Displays the number completed for the date range as well as a statistical comparison up or down for the same timeframe
Late Work Requests and Work Orders
Displays the number of late WR/WO's for the date range as well as a statistical comparison up or down for the same timeframe
Definition- Late means the WR/WO's Need By date is in the past
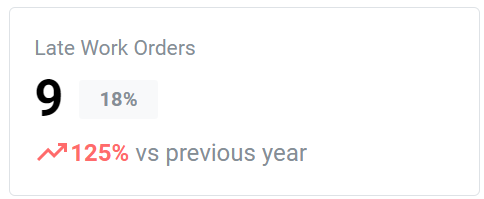
Displays the overall percentage late for the selected time frame
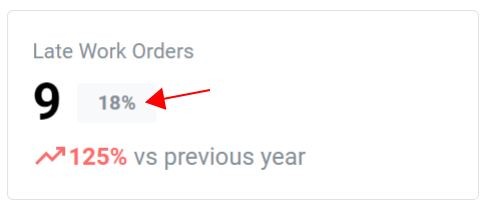
Calculation: Percentage Late = Number of late work orders / Total number of late work orders (all statuses)
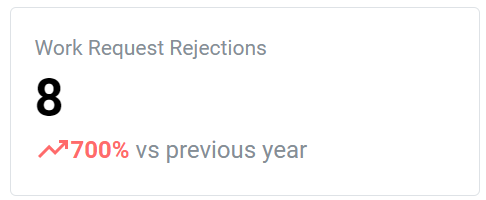
Work Request Rejections
Displays the total number of work request rejections for the date range as well as a statistical comparison up or down for the same timeframe
Lead Times
Lead times are one metric that can be used to understand your company's ability to meet the fabrication demands coming from your projects. Lead times can benchmark efficiency and identify the potential need for process improvements that can help reduce the overall time required to deliver fabrication to a project
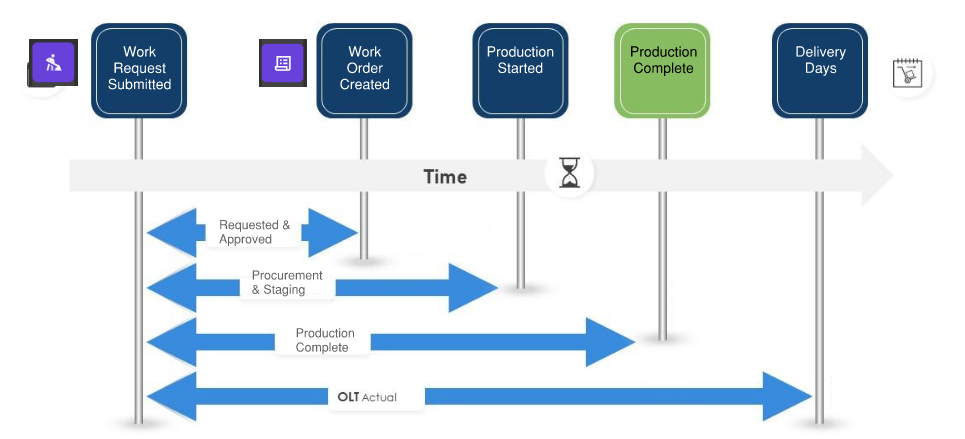
Avg. Order Lead Time (OLT)
Order lead time is the time it takes for your business to fulfil a projects fabrication order. Order lead time can be broken down into several component's, including:
- Processing: the time it takes to process the work request
- Material procurement: the time it takes order materials
- Production: the time it takes for fabrication
- Inspection: the time it takes for inspections and approvals
- Transportation: the time it takes to deliver the order
Definition- The time from work request submission to planned delivery
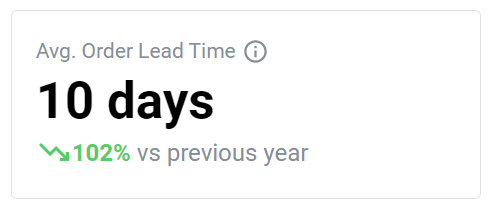
Stat Box: Displays the historical average order lead time for the date range as well as a statistical comparison up or down for the same timeframe
Calculation: Order Lead Time (OLT)= Production Complete Date - Order Received Date + Facility Delivery Days
Avg. Manufacturing Lead Time (MLT)
Manufacturing lead time is the time it takes to complete the order and deliver it to the project. Manufacturing lead time can be broken down into several component's, including:
- Material procurement: the time it takes for materials to arrive, receive and stage for production
- Production: the time it takes for fabrication
- Inspection: the time it takes for inspections and approvals
- Transportation: the time it takes to deliver the order
Definition- The time from work request approval (W/O created) to the time production is complete (Last task completed)
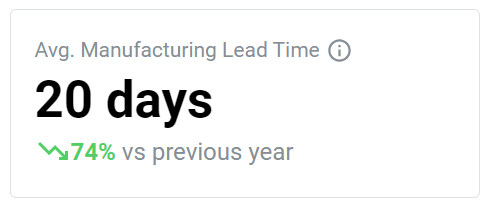
Stat Box: Displays the historical average for the date range as well as a statistical comparison up or down for the same timeframe
Calculation: Manufacturing Lead Time = Production Complete Date - Work Order Created Date
Avg. Production Lead Time (PLT)
Production lead time is the time it takes to complete the production process. Production lead time can be broken down into several component's, including:
- Production: the time it takes for fabrication
- Inspection: the time it takes for inspections and approvals
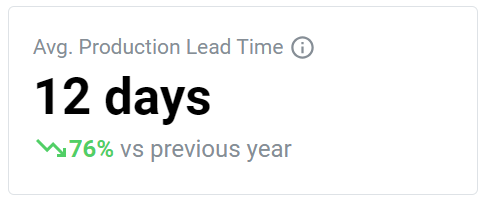
Stat Box: Displays the historical average for the date range as well as a statistical comparison up or down for the same timeframe
Definition- The time the first task is started to the time production is complete (Last task completed)
Calculation: Production Lead Time = Production Complete Date - Production Start Date
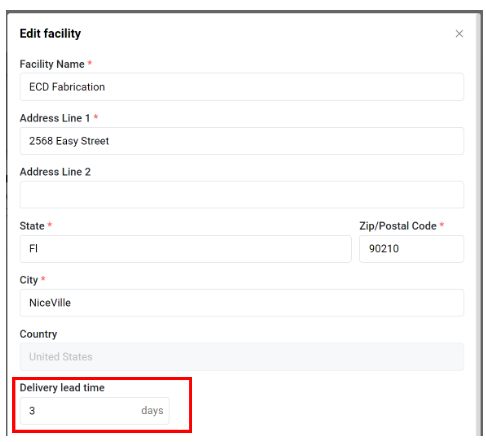
Delivery lead time (DLT)
Definition- The average number of days it takes for a completed work order to be delivered to the jobsite
Purpose- The facility DLT is used to calculate the 'Avg. Order Lead Time' (OLT) defined above
Access
- Users set as Company or Shop Administrators will have access to set the delivery lead time days for a facility
Setting the DLT
- select your facility and click Edit from the ellipsis menu
- enter a value in the Delivery lead time field and save
Filtering from the legend
You can filter the chart view by clicking on a status in the legend. Click again to return it to the view

Detailed report examples
You can use the filters to create reports for facilities and projects. Here are a few examples:
Wip report
Here is an example work in progress report for a facility
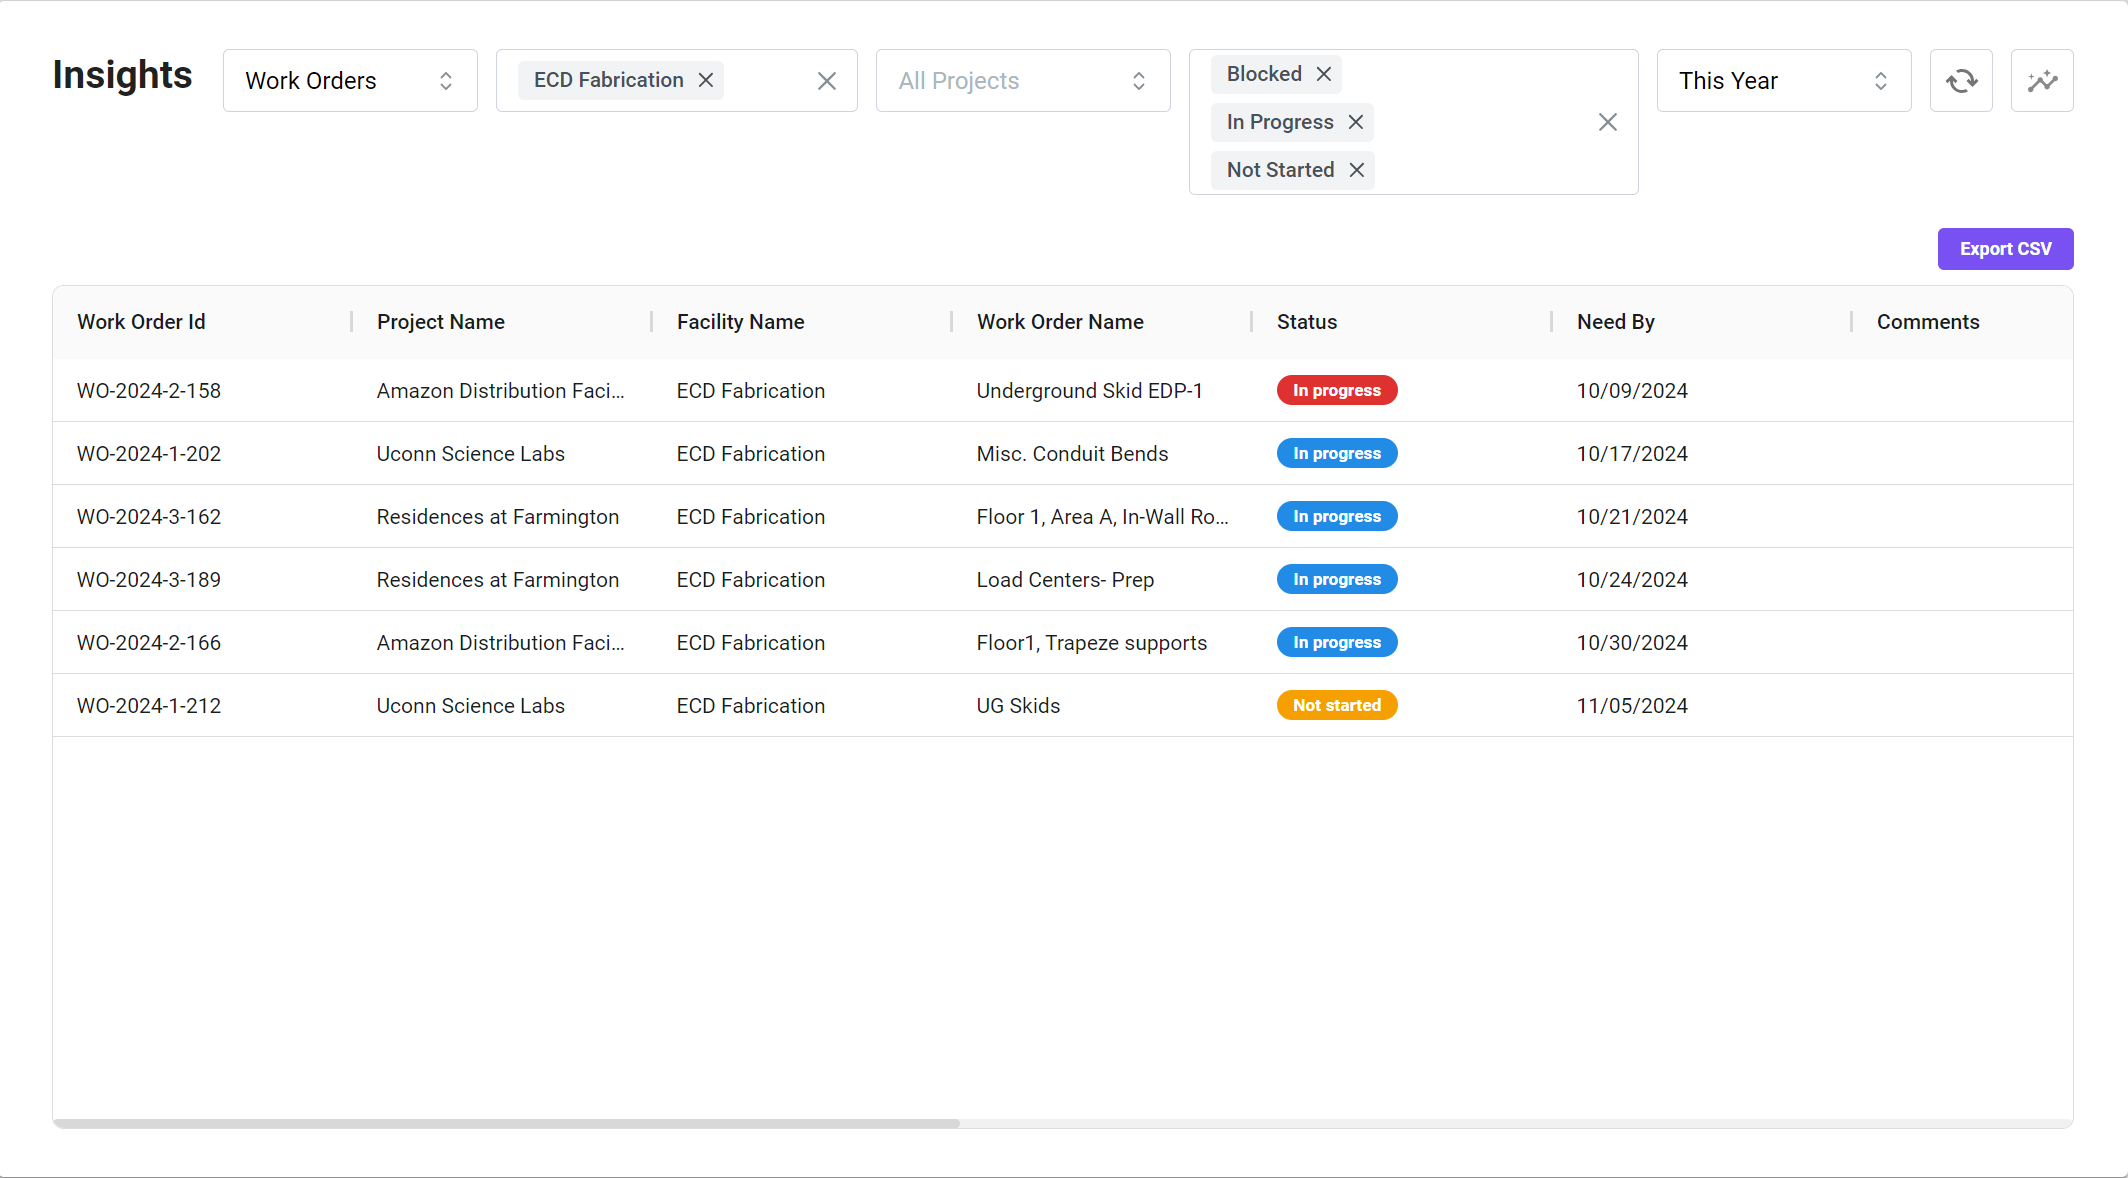
- using the filters, make the following selections:
- work orders
- select the facility
- select the statuses Blocked, In Progress & Not Started
- refresh data
Look Ahead report
Here is an example fabrication look ahead report for a facility
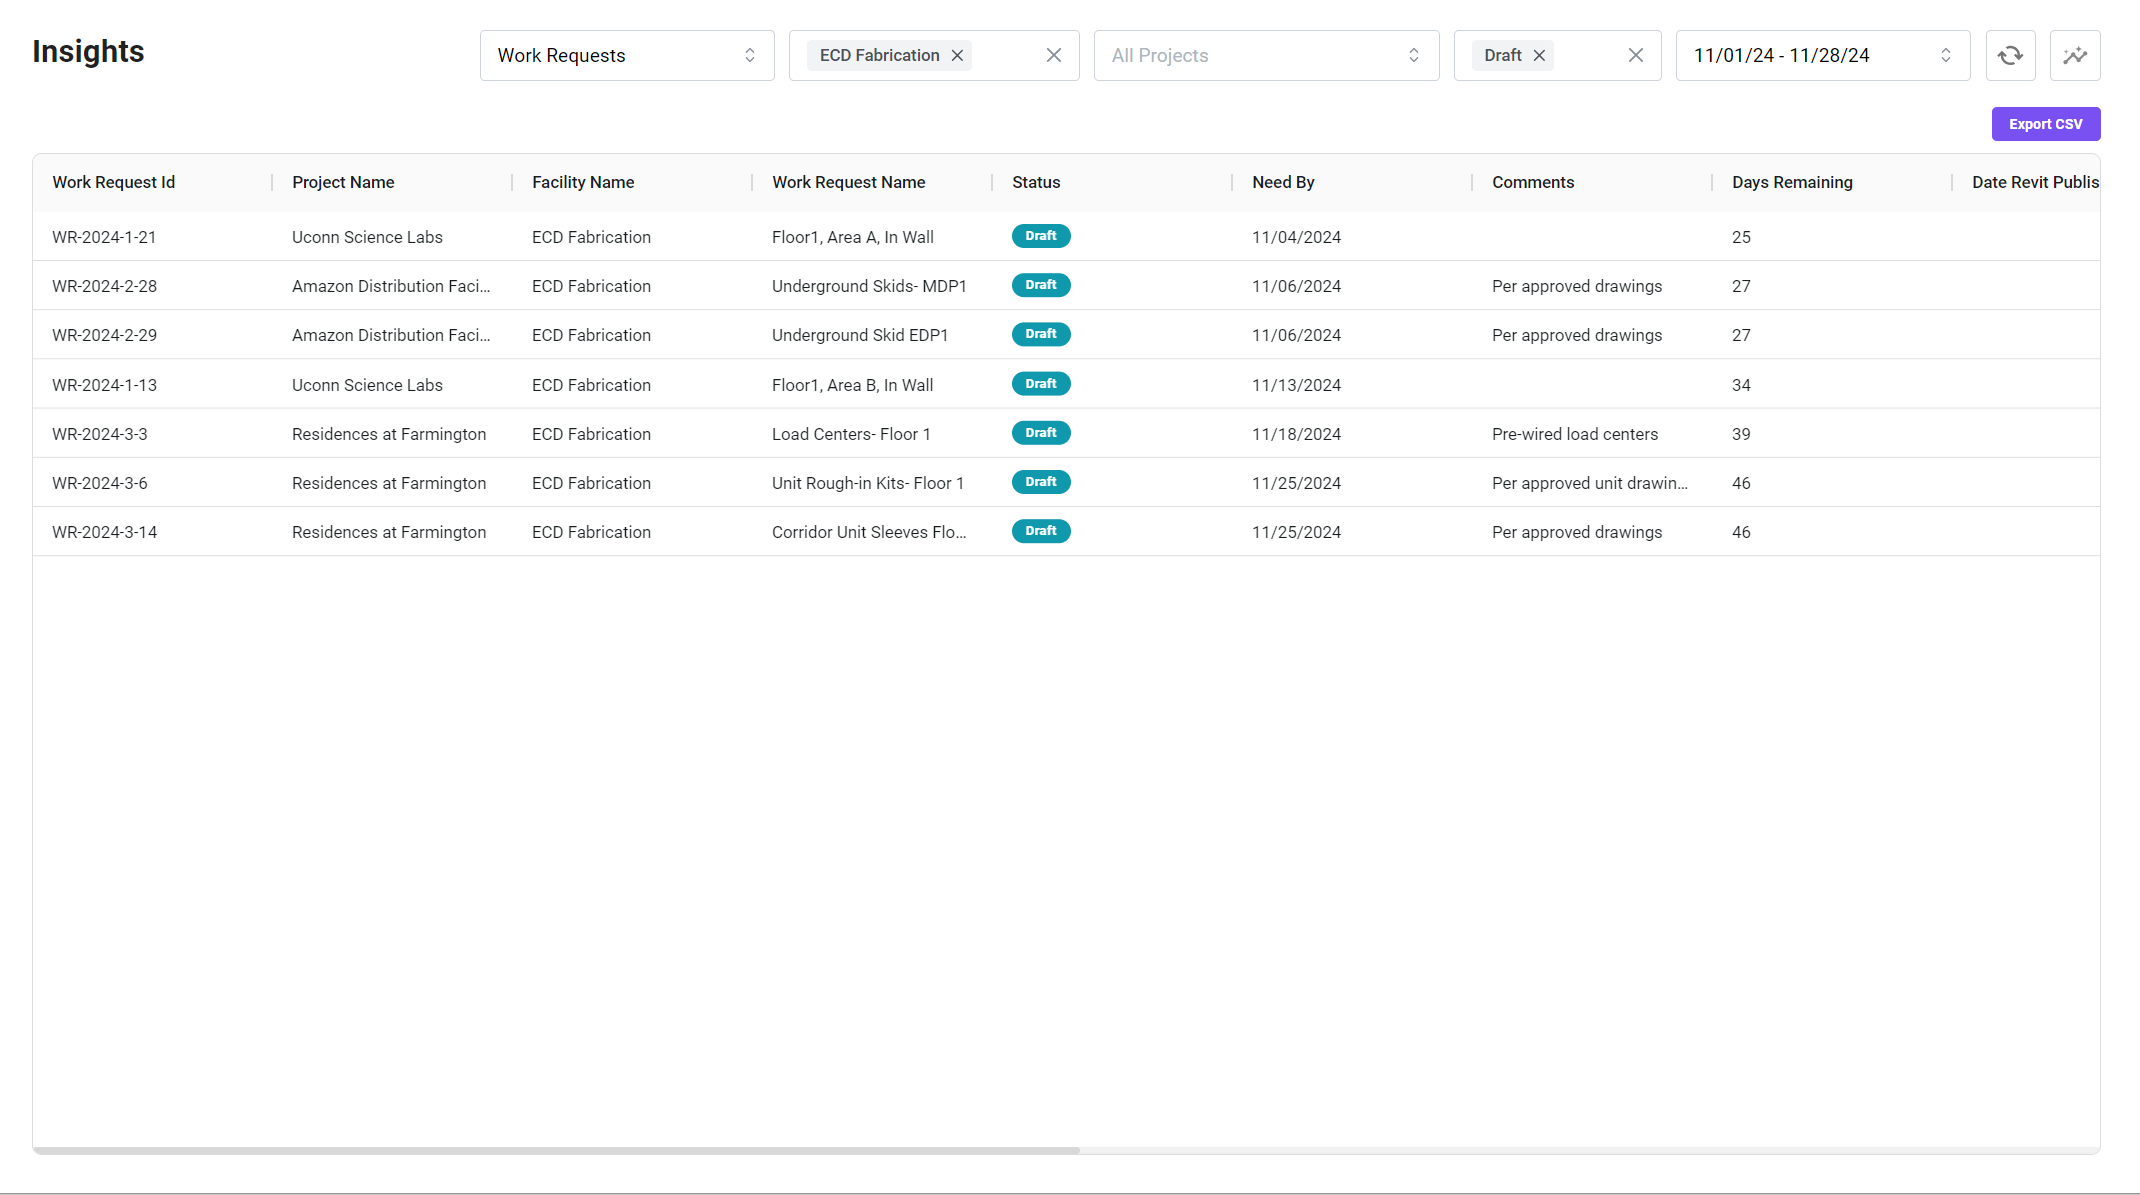
- using the filters, make the following selections:
- work requests
- select the facility
- select the status Draft
- sefresh data
Project Fabrication report
Here is an example fabrication report for a project
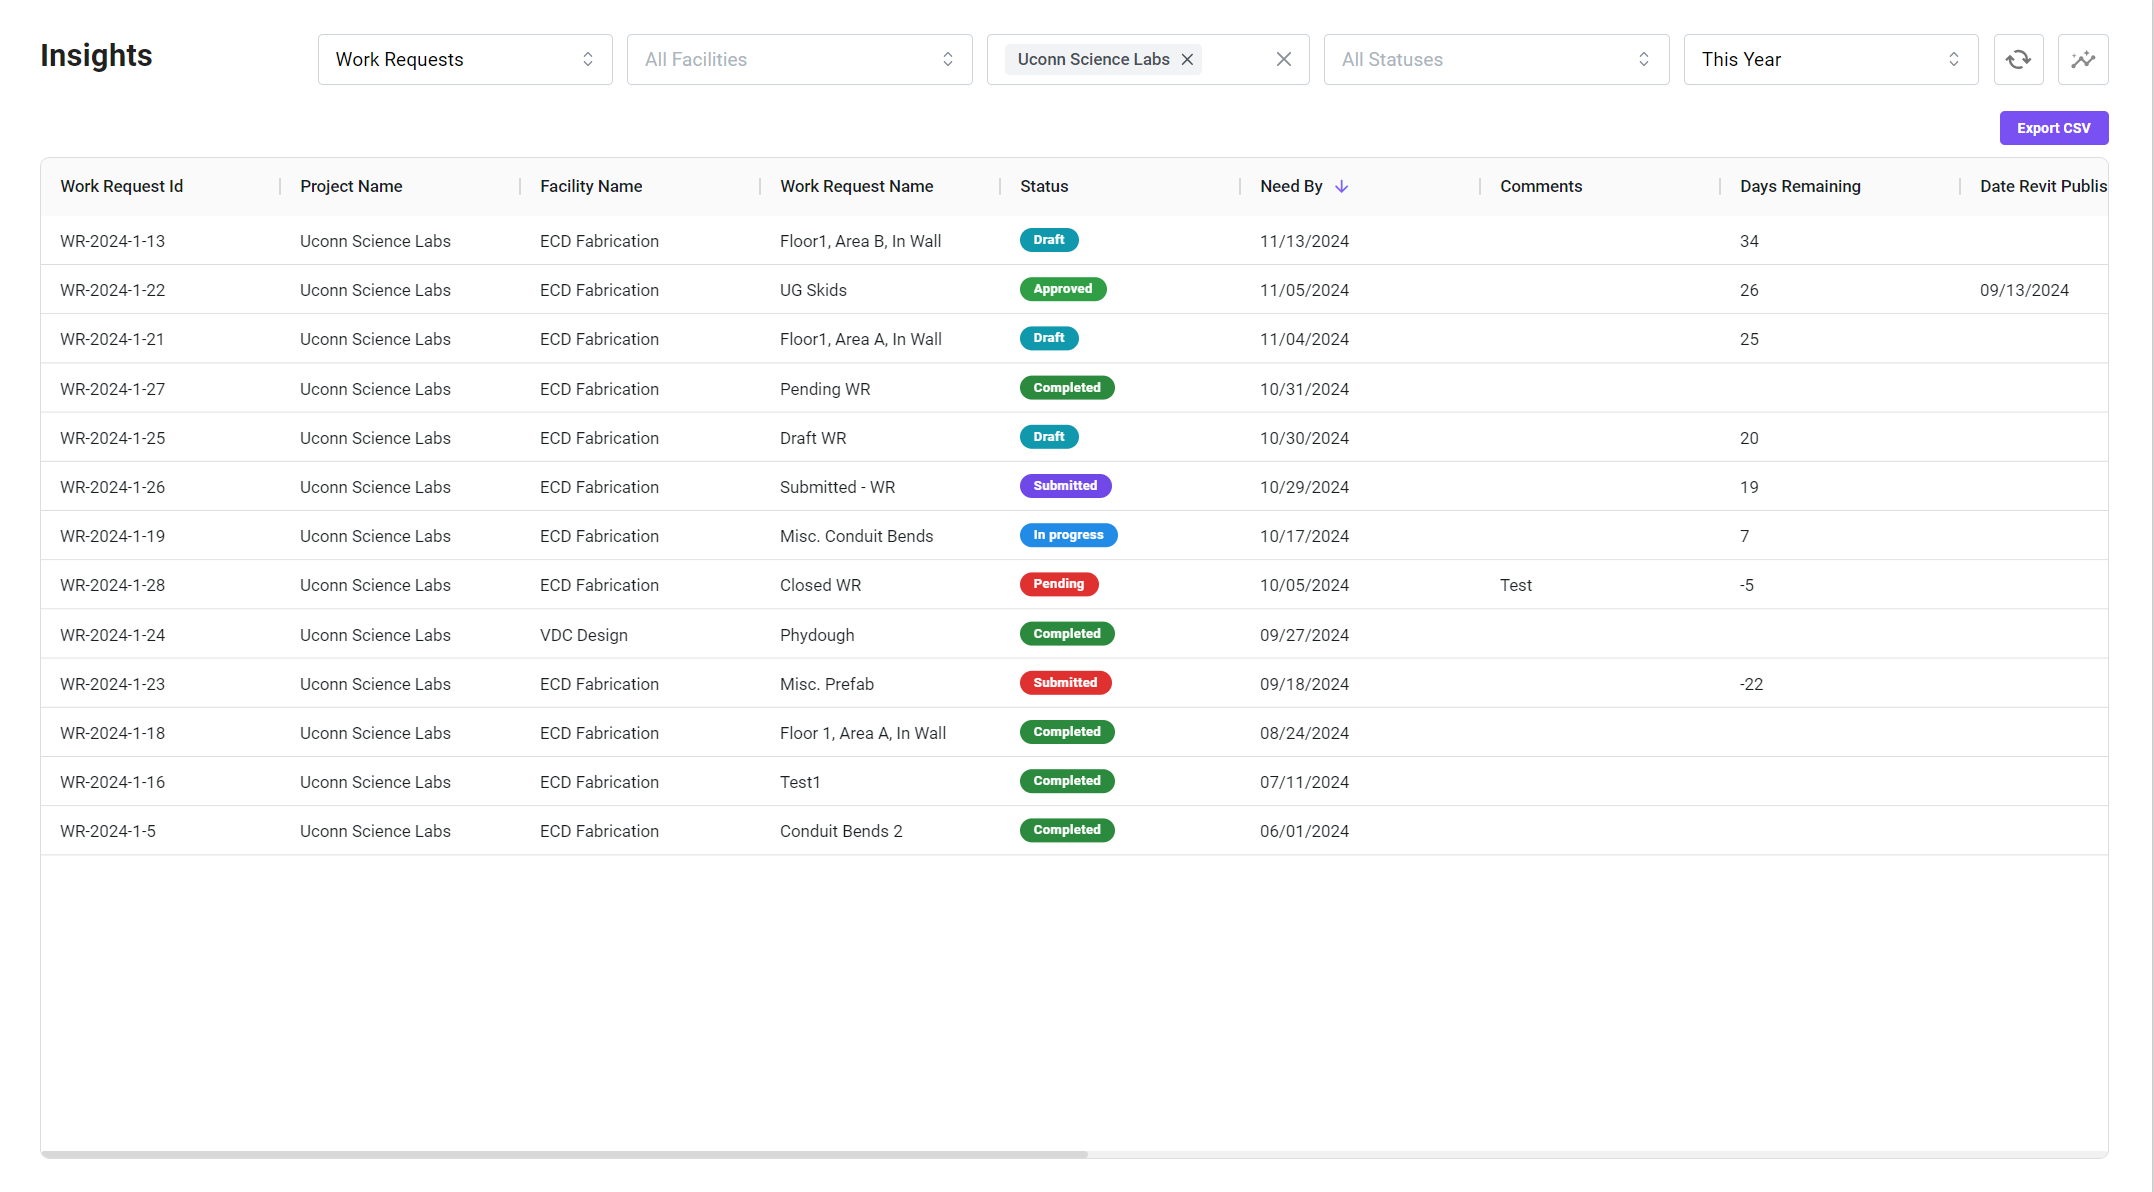
- using the filters, make the following selections:
- work requests
- select the project
- refresh data
Exporting reports
You can export reports to a CSV file button