VDC Insights

VDC Insights
The VDC Insights feature within EVOLVE Foresite provides administrators with interactive analytics on EVOLVE and Revit usage, helping teams understand feature adoption, user activity, and software trends over time.

When to Use
- Monitoring feature adoption
- Understanding user engagement
- Identifying training opportunities
- Tracking software version usage
- Supporting data-driven decisions
Requirements
- Users must be on EVOLVE version 8.2.6 or newer for data to be captured and displayed
- EVOLVE Electrical / Mechanical grants access to recent data (current and previous week)
- EVOLVE Professional grants access to extended historical data (up to one year)
Accessing VDC Insights

- Open EVOLVE Foresite
- Navigate to the Insights area within the left-hand panel
- Select VDC within the Insights dropdown options
- VDC Insights will display at the top of a page containing various charts
Filters and Controls
Across all VDC Insights charts, you can filter and control the following.

- Adjust time ranges
- Toggle between EVOLVE and Revit usage
- Filter by specific users
- Click into charts for deeper analysis
Feature Usage chart
Displays EVOLVE or Revit feature usage by user.
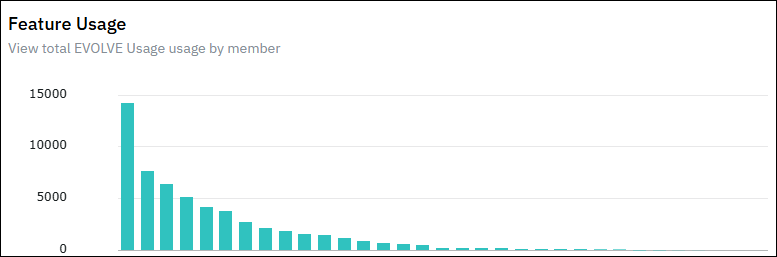
- View total feature interactions (Events)
- See unique features used per user
- Analyze average usage per user and per week
- Hover over chart elements for detailed metrics
In-Depth Feature Analysis chart
Provides detailed usage trends over time.
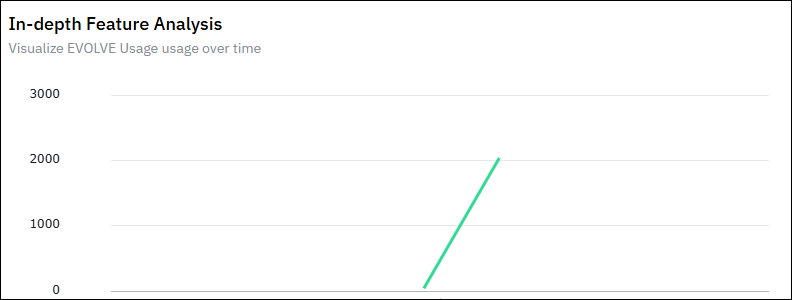
- View events by date
- Track events per user
- Analyze totals, averages, and trends
Feature Heatmap chart
Visualizes the most and least used features.
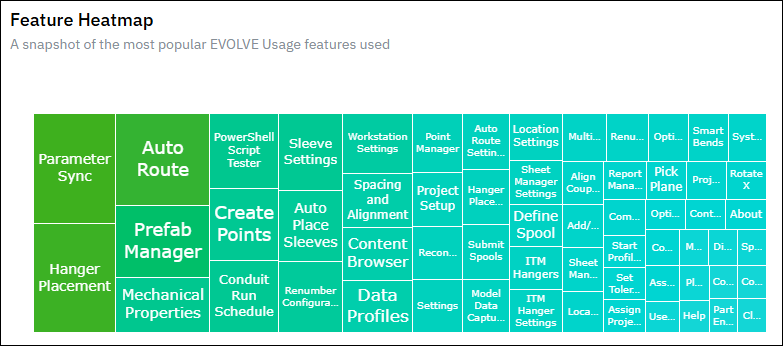
- Displays usage intensity across features
- Highlights:
- Most frequently used features
- Least used features
- Hover over cells to view exact values
- Summary includes total events and feature comparisons
Installed Versions chart
Shows which versions of EVOLVE and Revit are being used.
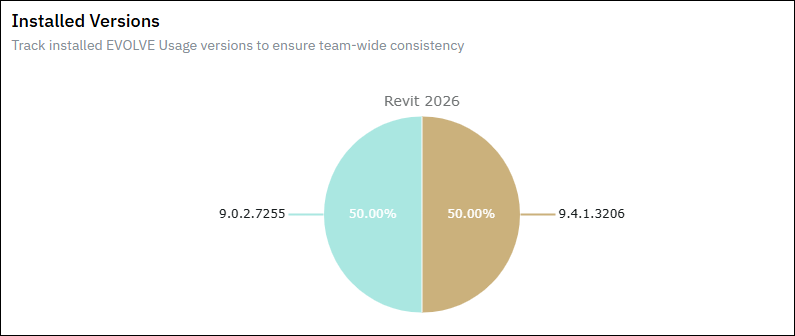
- View distribution of installed versions across users
- Understand upgrade trends over time
- Note: Results reflect usage within the selected time range, not a single point in time